> ## Documentation Index
> Fetch the complete documentation index at: https://aitextura.mintlify.site/llms.txt
> Use this file to discover all available pages before exploring further.
# Dashboard (Home)
> Overview of analytics on the AI Textura home page: 'Analytics', 'AI Quality', 'Response Time', and 'AI Efficiency' widgets, billing cards, balance, and the organization context.
The first thing you see after logging into AI Textura is the **Dashboard**. It consolidates analytics across all your AI employees: how many messages were processed, how many chats were opened, and how much it cost. One page — and you know exactly how your employees are performing.
Manage your virtual employees
Dialog management center
Billing history and balance
Your account parameters
***
## Video walkthrough
A short video tour of the **Analytics** and **Profiles** sections on the dashboard.
***
## Context: personal account vs organization
The dashboard shows a **different set of data** depending on the context you are in — a personal account or one of your organizations. The context is switched in the top menu (or via the organization selector in the sidebar).
| Context | What the dashboard shows |
| -------------------- | ------------------------------------------------------------------------------------------------ |
| **Personal account** | Employees, chats, and expenses tied to you personally |
| **Organization** | Aggregated data across all organization employees, the organization's overall balance, team KPIs |
If the data you expect isn't there — check whether you're in the right context. Personal account and organization analytics are not mixed.
***
## Analytics widget
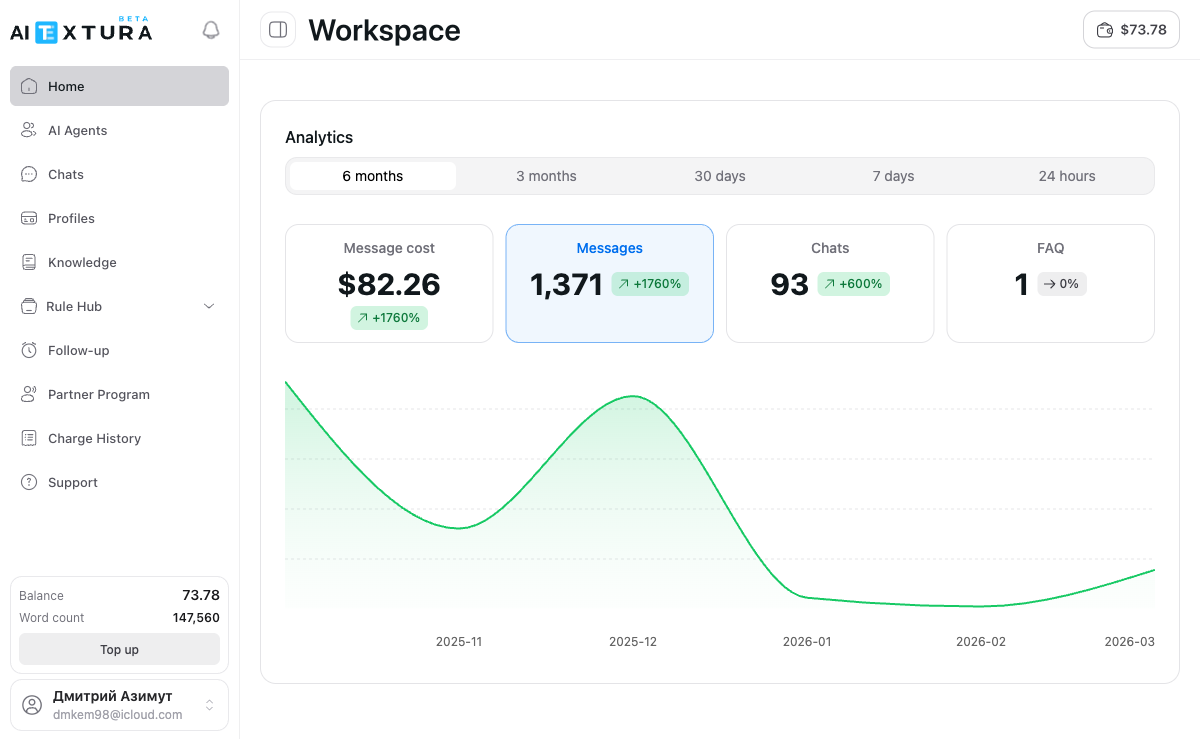
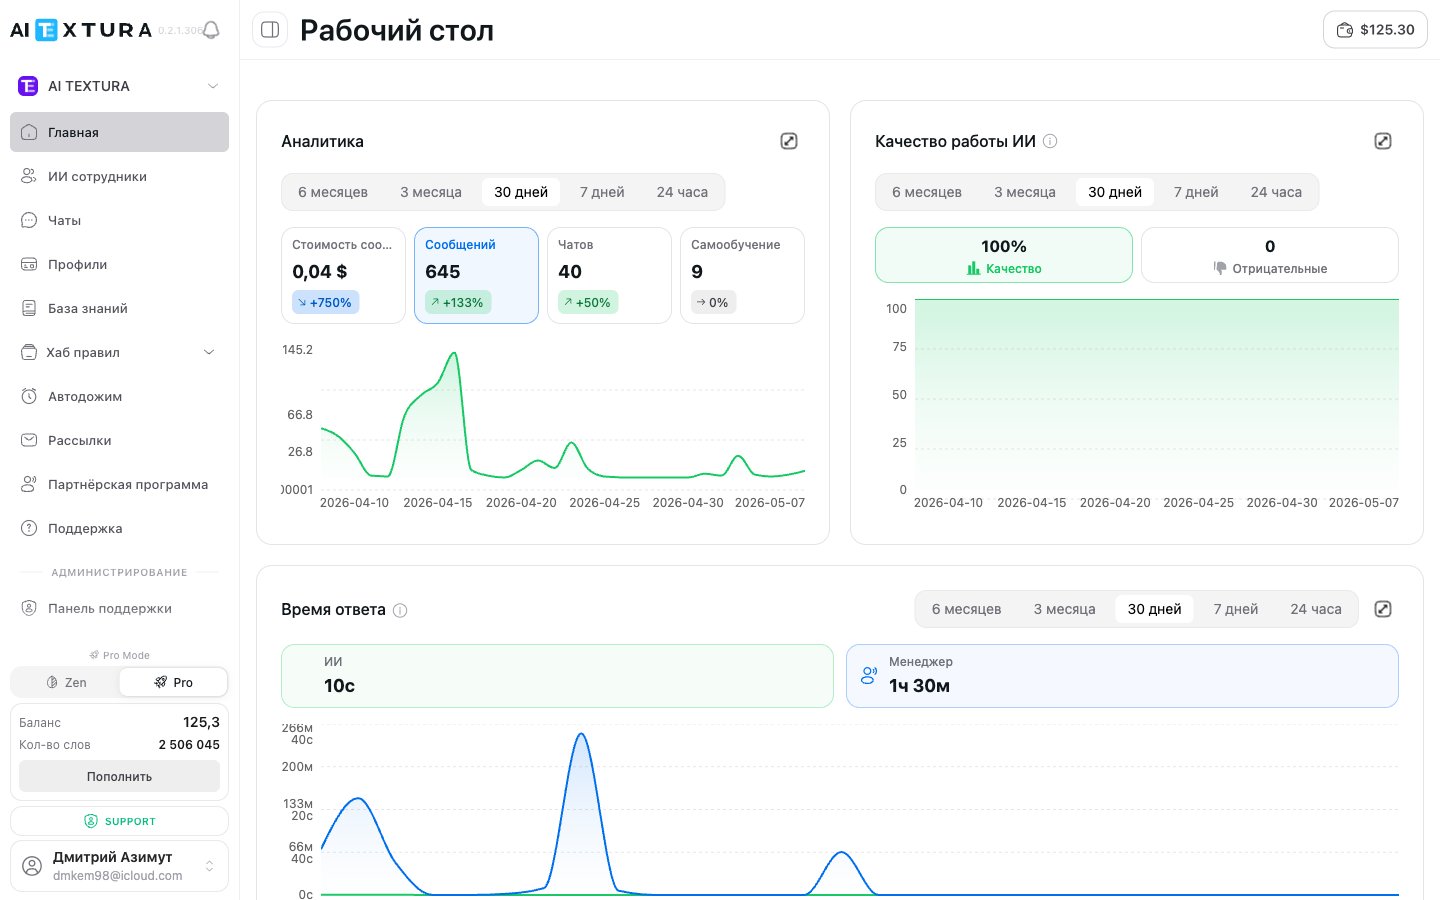
The page's main widget. The period switcher is on top, followed by metric cards and a line chart.
### Period switcher
| Period | What it shows |
| ------------ | --------------------------------------- |
| **6 months** | Half-year summary (selected by default) |
| **3 months** | Quarterly trends |
| **30 days** | Monthly overview |
| **7 days** | Weekly activity |
| **24 hours** | Data for the last day |
Click the desired tab — all metrics and the chart instantly redraw.
### Metric cards
Below the period switcher there are four clickable cards:
| Metric | What it shows |
| ----------------- | ------------------------------------------------------------------ |
| **Message cost** | Total message cost in dollars for the selected period |
| **Messages** | Total number of messages processed by all employees |
| **Chats** | Number of unique dialogs |
| **Self-Learning** | Number of questions that landed in the FAQ / self-learning section |
Each card displays a **percentage change** compared to the previous equivalent period. For example, +600% means a sixfold increase.
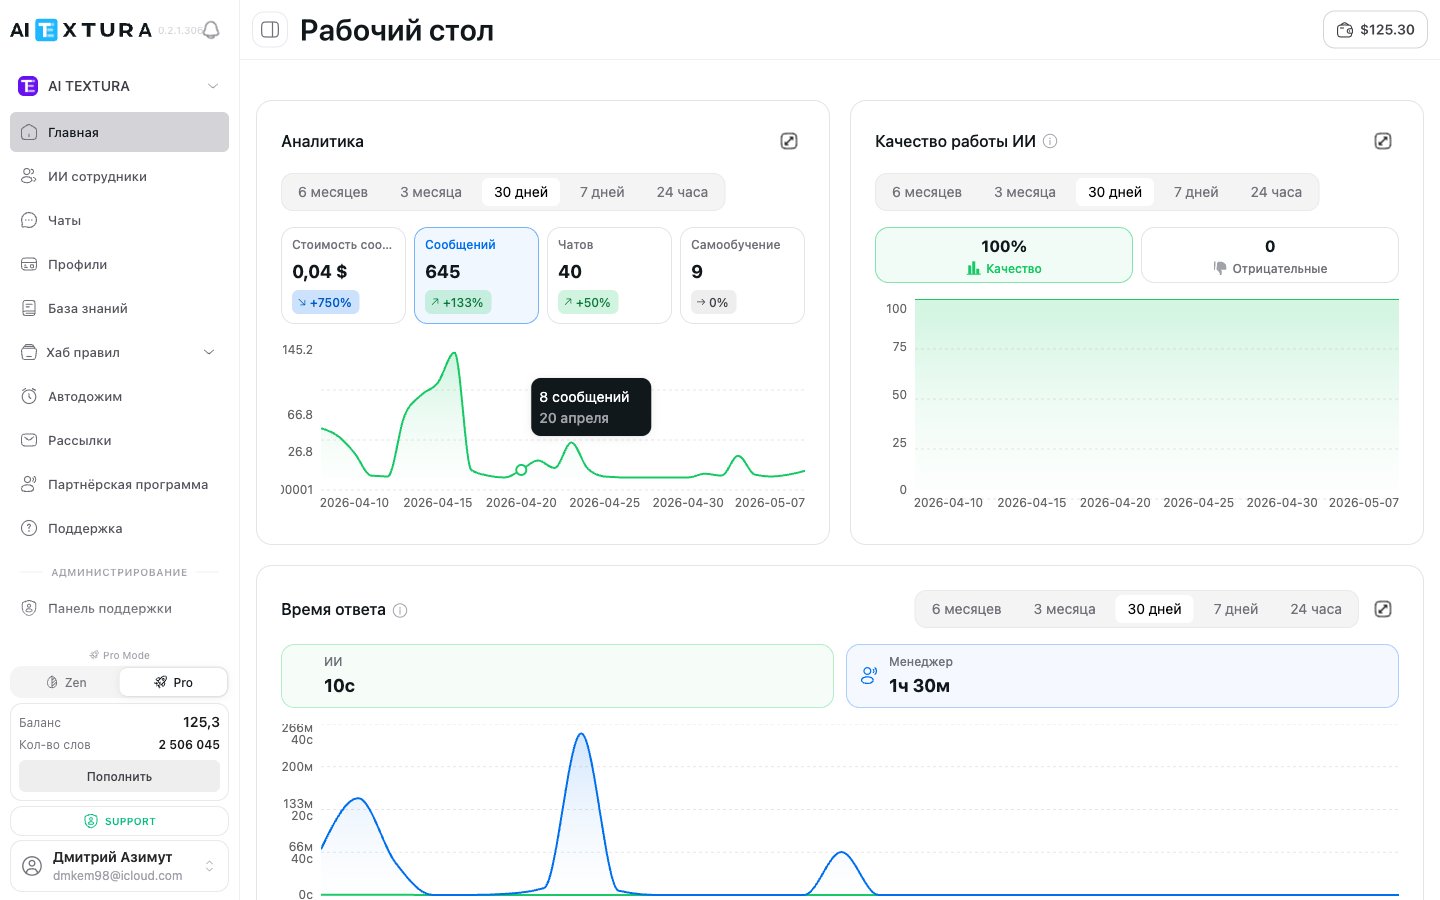
Click any card — the line chart below redraws to show the trend for that specific metric.
### Line chart
Below the cards is a line chart visualizing the selected metric over time. The horizontal axis shows dates, the vertical axis shows values. The chart automatically adapts to the selected period and metric.
***
## "AI Quality" widget
A separate widget that scores how well employees handle responses:
* **Quality %** — overall quality indicator for the selected period.
* **Negative** — number of responses clients or managers marked as poor (including via thumbs down).
* **Chart** — quality dynamics over time.
If quality drops sharply, open chats with negative feedback via the [Chats](/en/guides/chats) section and review specific dialogs. Often the issue is solved by one rule in the [Persona](/en/guides/persona) or one entry in the [knowledge base](/en/guides/knowledge).
***
## "Response Time" widget
The widget was added in **v2.5.0** — one of the headline monitoring additions of 2026.
The widget compares response speed in chats:
| Line | What it shows |
| ----------- | ------------------------------------------------------------------------------------------------------------- |
| **AI** | Average response time of the AI employee. Usually seconds (e.g., "9 s") |
| **Manager** | Average response time of a human manager when they join the chat. Usually minutes or hours (e.g., "1 h 30 m") |
The daily chart lets you see which days/hours managers respond more slowly than usual and where it makes sense to delegate more scenarios to the AI.
Compare "AI" and "Manager" — if the gap is very large, it's a signal that some routine questions in manager-only chats can be moved into [Quick Answers](/en/guides/quick-answers) or the [knowledge base](/en/guides/knowledge) so the AI handles them itself.
***
## "AI Efficiency" widget
An analytical widget with two display modes — **Table** and **Chart** — and three breakdowns:
| Breakdown | What it shows |
| --------------- | -------------------------------------------------------------------- |
| **By employee** | Effectiveness of each AI employee separately |
| **By channel** | Which channels (Telegram, Wazzup, Bitrix24, etc.) generate more load |
| **By dialog** | Distribution across specific chats |
Table columns:
* **Employee**
* **Dialogs**
* **Messages**
* **AI without manager** — dialogs where the AI handled it alone
* **Manager only** — dialogs where only a human replied
* **AI + manager** — mixed dialogs
An employee filter and pagination are available.
The "AI without manager" column is the best automation indicator. The higher the share of such dialogs, the less time your managers spend on routine work.
***
## "Spending and billing analytics" card
A separate card linking to the [Billing History](/en/guides/finance) section — there you'll see the detailed billing history per employee and channel, the organization balance, and top-ups.
***
## Balance and words
In the top-right corner of the screen (and in the sidebar), you can always see:
* **Balance** — current account balance in dollars
* **Word count** — remaining word limit
* **Top Up** button — for quickly adding funds
The balance is visible on every page of the platform — keep an eye on it so your employees don't stop due to insufficient funds. Balances of the **personal account** and the **organization** are stored separately — top up the context where the employees are running.
***
## How to use the dashboard
Make sure you are in the right context — personal account or a specific organization. The switcher is in the sidebar.
In the "Analytics" widget, click the desired tab: **24 hours**, **7 days**, **30 days**, **3 months**, or **6 months**.
Look at the four cards: message cost, number of messages, chats, and self-learning. Pay attention to the percentage change.
Click a card to update the line chart and display the trend for the selected indicator.
Scroll down and check the **"AI Quality"** and **"Response Time"** widgets. If you see anomalies — go to [Chats](/en/guides/chats) to review specific dialogs.
In the **"AI Efficiency"** widget, switch the breakdown (By employee / By channel / By dialog) to see where automation works best.
In the top right corner, make sure you have sufficient funds. If needed, click **Top Up**.
***
## FAQ
Yes, every time you visit the page you see the most current data.
The "Analytics" summary widget shows data across all employees. For detailed statistics on a specific employee, use the **"AI Efficiency"** widget (the "By employee" breakdown) or the [Billing History](/en/guides/finance) section.
It represents the change compared to the previous equivalent period. If "30 days" is selected, the comparison is with the preceding 30 days.
This is normal and expected. The AI employee replies instantly, while a manager joins when they see a notification or open the chat. The "Response Time" widget exists precisely to show this gap and help you decide which scenarios to hand to the AI.
The widget appeared in **v2.5.0**. If you're just starting out or have no dialogs with manager replies in the selected period, the charts will have little data. Expand the period to 30 days or more.
Most likely, your employees run in the organization context. Switch to the relevant organization in the sidebar — the data will appear.
 ***
## How to use the dashboard
***
## How to use the dashboard