AI Employees
Manage your employees
Dashboard
Platform-wide analytics
Persona
Tone and instruction settings
Knowledge Base
Connected data sources
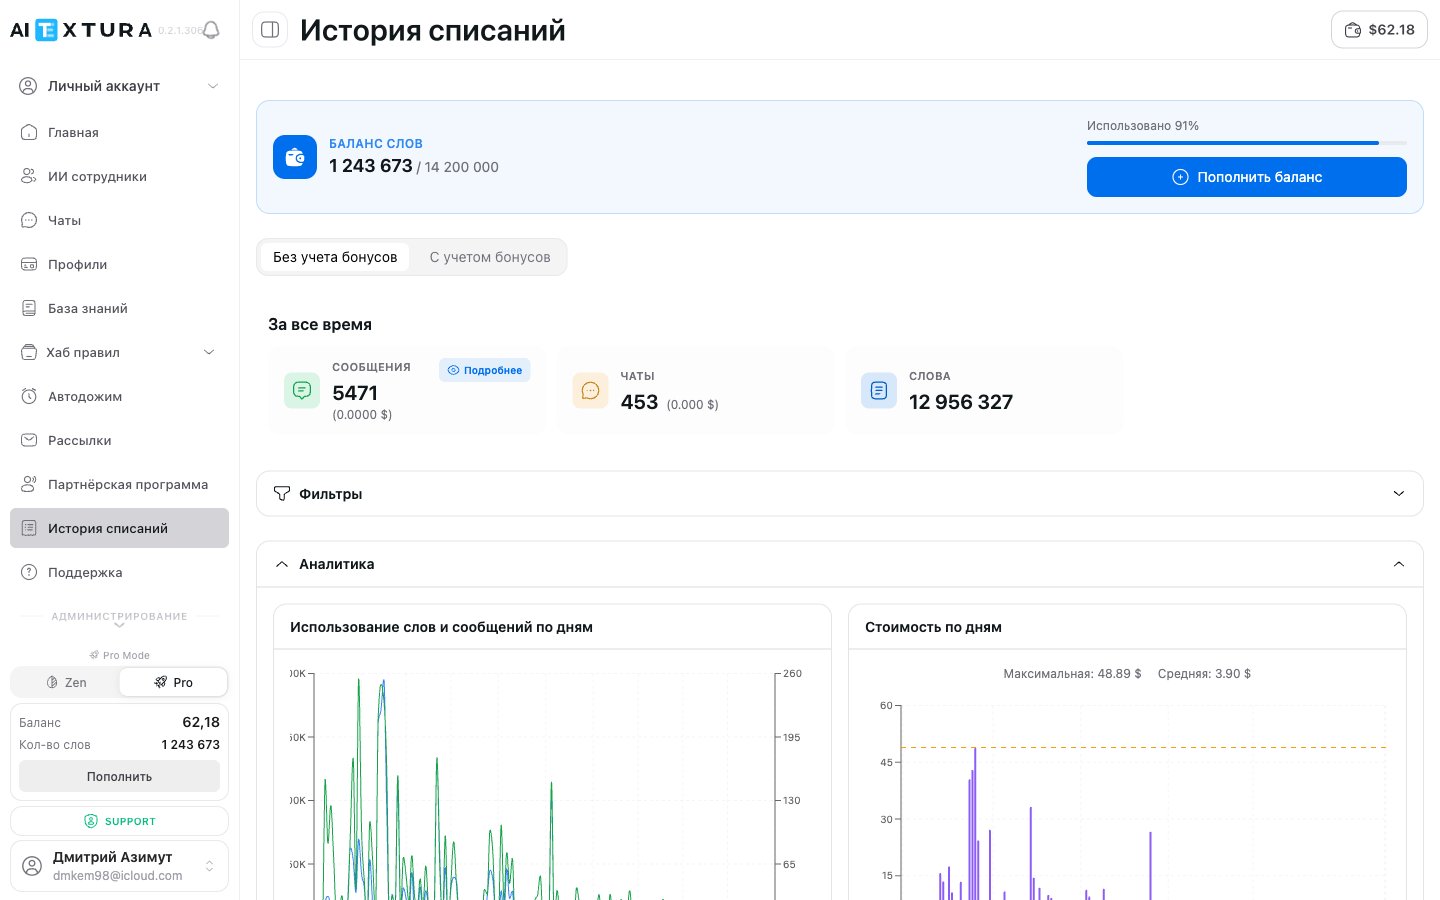
Page overview
When you open the section, you see several blocks from top to bottom:| # | Block | Purpose |
|---|---|---|
| 1 | Word Balance | Progress bar and usage numbers |
| 2 | Bonus Mode | Toggle between bonus / paid words |
| 3 | Summary Cards | Key totals: messages, chats, words |
| 4 | Filters | Period and employee selection |
| 5 | Analytics | Four charts |
| 6 | Billing History Table | Daily breakdown |
Word Balance
At the top of the page you’ll find the balance block:| Element | What it shows |
|---|---|
| Words used | How many words have been spent out of the total limit (e.g., 1,475,624 of 14,200,000) |
| Progress bar | Visual bar with usage percentage (e.g., “90% used”) |
| Top Up Balance button | Navigate to the top-up page |
- In the bottom left corner of the sidebar — dollar amount and remaining words
- In the top right corner — button showing the current balance in dollars
Bonus Mode
Below the balance block there is a toggle with two tabs:| Mode | What it shows |
|---|---|
| Excluding Bonuses | Actual expenses — only what was deducted from your paid balance |
| Including Bonuses | Total usage, including words received through bonus programs and promotions |
Summary Cards
Three cards with key figures for the selected period:| Metric | What it means | Example |
|---|---|---|
| Messages | Total number of messages and their total cost | 5,308 ($0.0000) |
| Chats | Number of unique conversations and their total cost | 424 ($0.000) |
| Words | Total number of words used | 12,724,376 |
Filters
The Filters button lets you narrow down data by two parameters:- By period — a specific date range (week, month, or custom interval)
- By employee — expenses for a specific AI employee
Analytics — four charts
The Analytics section contains four charts available at/billing/words/history. The block can be collapsed and expanded.
| # | Chart | What it shows |
|---|---|---|
| 1 | Words and messages by day | How many words and messages were used each day in the period |
| 2 | Cost by day | Daily spending in dollars + maximum and average daily cost |
| 3 | Chats and messages by day | Client activity: number of new dialogs and messages |
| 4 | Monthly cost trend | Long-term dynamics — total spending and average daily cost by month |
1. Words and messages by day
A combined chart with two axes:- Left axis — number of words (thousands)
- Right axis — number of messages
2. Cost by day
A line chart of daily expenses in dollars. Above the chart:- Maximum daily cost (e.g., $48.89)
- Average daily cost (e.g., $4.42)
3. Chats and messages by day
A combined chart:- Left axis — number of chats (dialogs)
- Right axis — number of messages
4. Monthly cost trend
A long-term chart with two lines:- Total expenses ($) — total spending per month
- Average daily expenses ($) — averaged daily cost
Billing History table
A detailed table broken down by day. Each row represents one day with charges.| Column | What it shows |
|---|---|
| Date | Day of the charge (DD.MM.YYYY) |
| Type | Charge type (if applicable) |
| Words | Number of words used that day |
| Messages | Number of messages that day |
| Cost | Total cost for the day in dollars |
| Dialogs | Number of unique chats that day |
| Per dialog | Average cost per dialog |
| Per message | Average cost per message |
Pricing plans
AI Textura uses a word-based pricing model: Cost = Number of words x Price per word The price per word depends on your plan. The larger the word package, the lower the cost per word.Current plans
| Plan | Price | Word volume | Best for |
|---|---|---|---|
| Starter | $100 | 2,000,000 words | Launch, testing, 1–2 AI employees |
| Pro | $500 | 10,000,000 words | Active use, several AI employees, mid-volume client traffic |
| Business | $1000 | 20,000,000 words | Chains, agencies, high client traffic, or large knowledge bases |
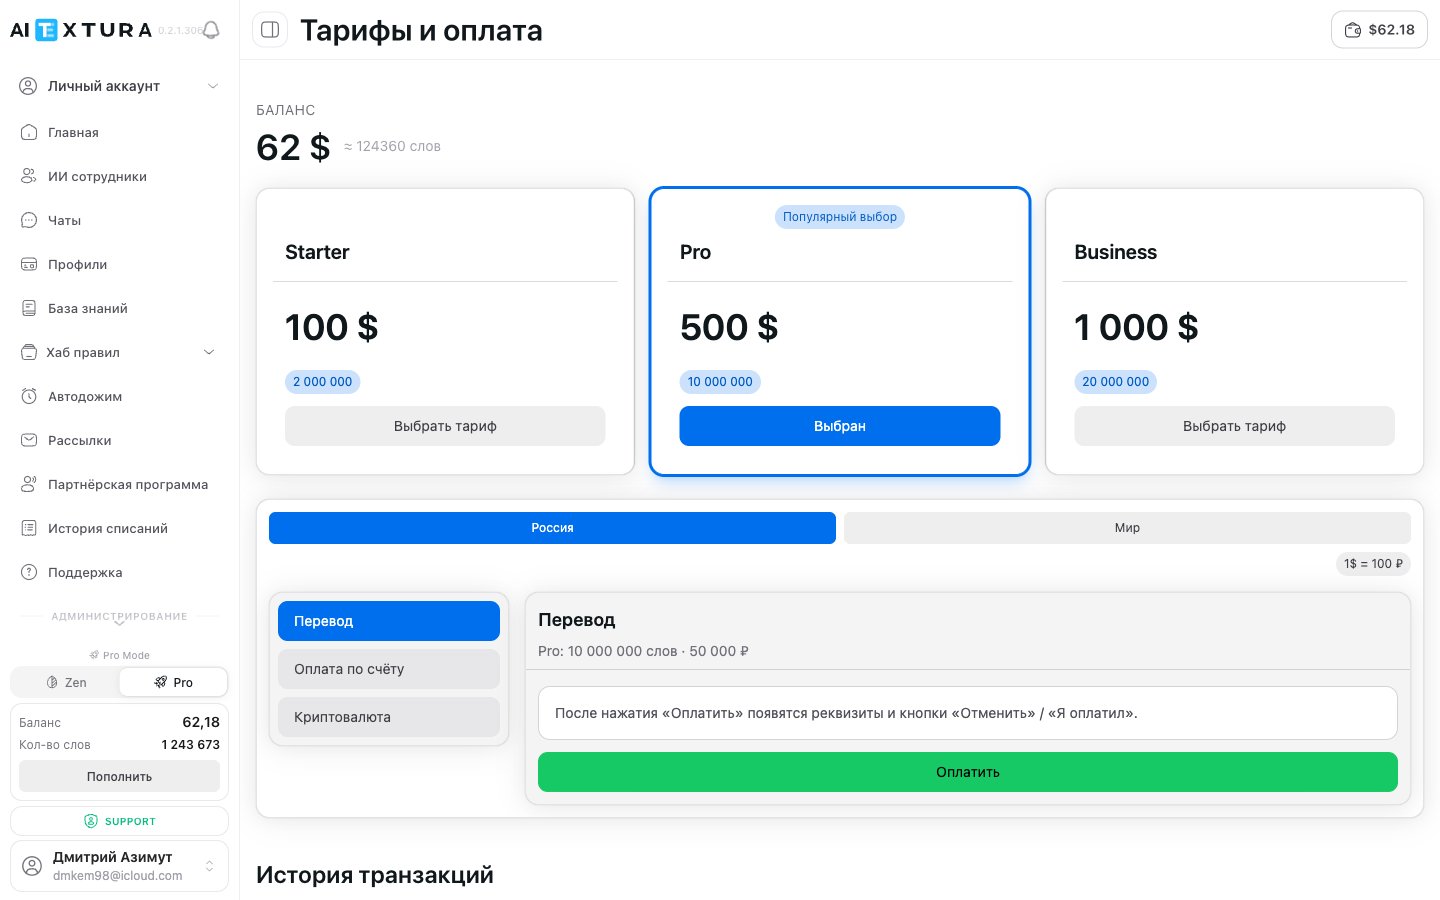
Regions and payment methods
The platform supports two regional payment gateways:| Region | Payment methods |
|---|---|
| Russia | Bank transfer (to a settlement account), invoice payment (the platform issues an invoice), cryptocurrency |
| World | International cards and payment systems |
The Cryptocurrency method is available in the “Russia” region — convenient if you don’t have Russian payment details or if your card doesn’t pass through international gateways.
Transaction history
After topping up the balance, entries appear in the Transaction history table on the plans page:| Column | Description |
|---|---|
| Date | Date and time of the transaction |
| Amount | Top-up amount |
| Currency | Payment currency ($ or ₽) |
| Words | How many words were added to the balance |
| Gateway | Payment gateway — e.g., “International” or the corresponding Russian gateway |
| Plan | Which plan was applied (Starter / Pro / Business) |
| Method | Payment method (card, transfer, cryptocurrency) |
| Status | Successful transaction or error |
Factors affecting word consumption
| Factor | Impact |
|---|---|
| AI employee response length | Longer responses use more words |
| Conversation context | Longer dialogs consume more — the AI considers previous messages |
| Knowledge Base | Querying the knowledge base increases usage |
| Profiles (Realtime) | Updating the profile after each message adds words |
| Talents | Using external integrations may increase usage |
Tips for reducing costs
Shorten response length
Add an instruction to the Persona tone: “reply briefly, no more than 2-3 sentences.” This can cut word usage several times.
Switch profile updates
Change Realtime mode to scheduled updates (e.g., once every 24 hours). This significantly reduces consumption.
Optimize the knowledge base
Remove outdated and redundant documents. The more compact the base, the fewer words are used per query.
Use quick replies (FAQ)
Set up FAQ for common questions — they use fewer resources than full response generation.
Step-by-step guides
How to view expenses for a period
How to find which employee spends the most
Review the data
Check the summary cards and charts — they will show usage for that specific employee.
How to top up your balance
Click 'Top Up'
Use the button at the bottom of the sidebar or “Top Up Balance” on the billing history page.
FAQ
What are 'words' and how are they counted?
What are 'words' and how are they counted?
Words are the unit of measurement on the platform. Every message (from both the client and the AI employee) consumes a certain number of words. This includes the message text, conversation context, knowledge base queries, and talent operations. A typical AI employee message can consume from a few hundred to several thousand words.
Why does the cost per message differ between employees?
Why does the cost per message differ between employees?
The cost is affected by response length, context size (length of the previous dialog), knowledge base and talent usage, and the profile update mode. An employee with short responses and scheduled profile updates will cost significantly less.
What does the 'Type' column in the table mean?
What does the 'Type' column in the table mean?
The “Type” column shows the charge category. If no type data is available, “No data” is displayed.
What happens if the word balance runs out?
What happens if the word balance runs out?
All active AI employees will pause. Clients will stop receiving responses until you top up your balance. We recommend topping up in advance and monitoring the progress bar.
What is the difference between 'Excluding Bonuses' and 'Including Bonuses'?
What is the difference between 'Excluding Bonuses' and 'Including Bonuses'?
“Excluding Bonuses” shows only paid word usage. “Including Bonuses” also counts words received through the referral program or promotions. If you do not participate in bonus programs, there will be no difference.
Can I view expenses for a specific employee?
Can I view expenses for a specific employee?
Yes. Click Filters and select the desired AI employee. All data on the page will recalculate for that employee only.
How often is the data updated?
How often is the data updated?
Data is updated in real time. Every new message is immediately reflected in the statistics.
Where can I check my balance without going to Billing History?
Where can I check my balance without going to Billing History?
The balance is always visible at the bottom of the sidebar (dollar amount and word count) and in the top right corner of any page (button with the dollar amount).
Which plan should I pick?
Which plan should I pick?
If you’re just launching 1–2 AI employees and want to try the platform — go with Starter (500 / 10,000,000) — the price per word drops. Chains and agencies with high client traffic pick Business ($1000 / 20,000,000).
Can I pay from Russia?
Can I pay from Russia?
Yes. In the “Russia” region three methods are available: bank transfer, invoice payment, and cryptocurrency. Conversion rate $1 = 100 ₽.
What does the 'Gateway' column in the transaction history show?
What does the 'Gateway' column in the transaction history show?
The gateway is the payment system that processed the transaction. For example, “International” if you paid with a foreign card. For Russian payments, the corresponding Russian gateway is shown.